Plotting coordinates on map

Leaflet can be used for plotting coordinates on a map without any hassle. For this we will have to first identify what kind(point, polygons etc) of plotting do we want on map, accordingly we make the Geojson object. Geojson geometry type Point could be used f or plotting different points on map, type Polygon could be used for plotting a country/state boundary or line could be used for representing a line on map etc. Lets see how can we plot a single Point on map.

For this lets make a HTML file say, index.html. In this we can either download leaflet.js library or use its CDN link. For now we are using the CDN links for leaflet css and js libraries.

Copy the below code in your index.html and open the file in your web browser.

<!DOCTYPE html>
<html>
<head>
	<meta charset=utf-8 />

	<meta name='viewport' content='width=device-width, initial-scale=1,maximum-scale=1,user-scalable=no' />
	<link rel="stylesheet" href="https://unpkg.com/leaflet@1.0.3/dist/leaflet.css" />
	<script src="https://unpkg.com/leaflet@1.0.3/dist/leaflet.js"></script>
	<style>
			#map {
				width: 600px;
				height: 400px;
			}
	</style>
</head>
<body>
	<div id='map'></div>
</body>
<script>

	var geojsonFeature = {
		"type": "Feature",
		"properties": {
			"name": "Coors Field",
			"amenity": "Baseball Stadium"
			},
		"geometry": {
			"type": "Point",
			"coordinates": [-104.99404, 39.75621]
		}
	};

	var osm = L.tileLayer('http://b.tile.openstreetmap.org/{z}/{x}/{y}.png', {
			maxZoom: 16,
			attribution: 'Map data &copy; <a href="http://openstreetmap.org">OpenStreetMap</a> contributors, <a href="http://creativecommons.org/licenses/by-sa/2.0/">CC-BY-SA</a>, Imagery <a href="http://stamen.com">Stamen</a>'
		  });
	var map = L.map('map').fitWorld().addLayer(osm);
	map.setView([39.73, -104.99], 10);
	L.geoJSON(geojsonFeature).addTo(map);
</script>
</html>

If you see something like this image.

LeafletPoint.PNG

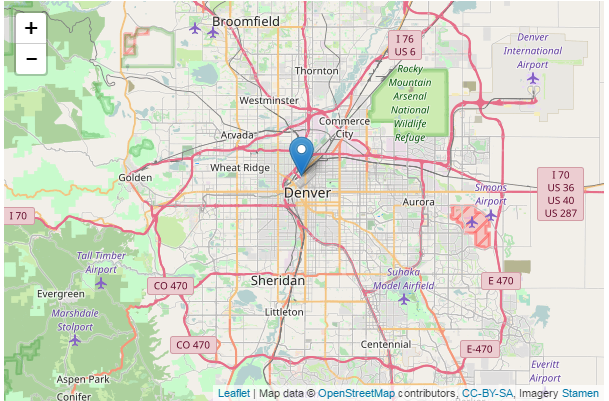
Congratulations !!! You have succesfully able to plot a point on map.
Line 21: It is the geojson object/data which needs to be plotted on map.
Line 33: It represents the object having the link to open street map tile servers. This link can be changed as well to show some cool maps. You can try raster maps cartodb-basemaps.
Line 37: This creates the map object. It takes the HTML DOM id i.e. ‘map’ in this case.
Line 38: Sets the default view of the map when the map loads and initial zoom level, 10 in this example.
Line 39: This adds the geojson data with the map object.

Moreover, the above ‘geojsonFeature’ object only a feature but the same object can be manipulated to
show feature collections that is the same object containing different types of geometries(Lines, polygons etc.)
Foe example the below ‘geojsonFeature’ represents two lines.

var geojsonFeature = {
 "type": "FeatureCollection",
 "features": [ {
 "type": "Feature",
 "geometry": {
 "type": "LineString",
 "coordinates": [
 [-105.04783630371094,39.77054750039529],
 [-104.94758605957031,39.73253798438173],
 [-104.9468994140625,39.6834113242346]]}
 },
 {
 "type": "Feature",
 "geometry": {
 "type": "LineString",
 "coordinates": [[-105.05538940429688,39.75154536393759],
 [-104.96955871582031,39.71933533081653],
 [-104.97093200683594,39.6834113242346]]}
 }]
 };

In the next blog we will explore more features of Leaflet like adding popup with the markers and adding colors etc.

What is Leaflet ? What can be done with this. Its setup and plugins.

Leaflet is an open source JavaScript library for web mapping applications. It works across all major mobile and desktop platforms, supporting HTML5 and CSS3. Along with OpenLayers, and the Google Maps API, it is one of the most popular JavaScript mapping libraries.

Leaflet allows developers to display tiled web maps hosted on a public server, with optional tiled overlays and plotting location point of different forms. It can load feature data from GeoJSON files, style it and create interactive layers and visualization, such as markers with popups on click or hover.

The leaflet setup is pretty simple. In order to start using it straight away, place this in the head of your HTML code:

<link rel="stylesheet" href="https://unpkg.com/leaflet@1.0.3/dist/leaflet.css" />
https://unpkg.com/leaflet@1.0.3/dist/leaflet.js

OR

This can also be downloaded from here.
Unzip the downloaded archive to your website’s directory and add this to the head of your HTML code:

<link rel="stylesheet" href="/path/to/leaflet.css" />
/path/to/leaflet.js <!-- or use leaflet-src.js --!>

Leaflet could be used with some plugins like Marker Cluster, geojson-vt for plotting large data sets and others to get some great visualizations on map.

I will be covering all of these in details in my coming articles.

Development with GeoJson

GeoJSON is a format for representing geographic data structures. As the name suggests it follows JSON (Javascript Object Notation) rules for writing these data structures, hence can be easily provided to browser applications for plotting different data sets. Each GeoJSON object may represent a geometry, a feature, or a collection of features.
GeoJSON geometry types can be Point, LineString, Polygon, MultiPoint, MultiLineString, MultiPolygon, and GeometryCollection. Features in GeoJSON contain a geometry object and additional properties(like: color, country, name etc.), and a feature collection represents a list of features.

These Geojson objects could be directly kept in a javascript object or provided to browser in a json file through Ajax request.
A typical Geojson object looks like:

{ 
 "type": "FeatureCollection",
 "features": [
    { "type": "Feature",
       "geometry": {"type": "Point", "coordinates": [78.9629, 20.5937]},
       "properties": {"Name": "India"}
    },
    { "type": "Feature",
       "geometry": {
      "type": "LineString",
      "coordinates": [
         [ 75.0585, 22.7761], [78.6840, 22.7761], [82.3974, 22.8369]
         ]    },
      "properties": { "name": "A_Line",
                      "color": "#227455"
                    }
    },
    { "type": "Feature",
       "geometry": {
       "type": "Polygon",
       "coordinates": [
                [   
                  [76.8164, 27.2936], [75.3222, 25.0597], [75.3222, 21.9430], 
                  [80.5957, 22.3500], [80.3320, 25.5972], [78.6621, 27.3717],
                  [76.8164,27.2936]
                ]
            ] },
       "properties": {
       "prop0": "A_Polygon",
       "prop1": {"this": "that"}
       }
     }
  ]
 }

There are various data sets of Geojson available online for plotting different countries, states etc.

It is also possible to create your custom Geojson data set through different online tools like geojson.io.
These tools can also be used to validate your Geojson data, but it would be good for you if they are used with only trivial/light data sets, as large data sets may result in browser paralysis.
In that case, you will have to develop and use some of the good open source frameworks available like Leaflet for data plotting and visualization.

For more info on Geojson follow.
You will be able to do some great things using Leaflet by going through upcoming articles on Leaflet.